




Chrome Extension Revenue Benchmarks: What to Expect by User Count
See realistic Chrome extension revenue by user tier, from 500 to 200,000 users, across freemium, subscription, and lifetime-deal models.
Generic table on this page → specific Est. monthly on 9,656 listings
20 free sample rows · no signup · $23.20 one-time · 30-day refund
Article content
The average Chrome extension earns $862,000 per year — but that number is almost useless to you. It's pulled up by giants like GMass ($5.4M/year) and Momentum ($996K/year), which distort every average they touch (Starter Story, 2025). What you actually need are chrome extension revenue benchmarks broken down by user count, so you can set realistic targets at your current stage and know what levers to pull next.
In this guide, you'll get a tier-by-tier revenue benchmark table, a plain-English breakdown of what drives income at each stage, and a clear picture of which monetization model fits where. To plug your own user count, conversion rate, and ARPU into these benchmarks, run your numbers with the revenue calculator.
The browser extension market hit $7.8 billion in 2024, growing 23% year-over-year (Forbes, 2025). The market is growing and the demand is real. The question isn't whether extensions can generate income — it's what's realistic at your user count right now.
How Much Can You Actually Earn From a Chrome Extension?
The honest answer: it varies by an order of magnitude depending on your user count, your niche, and your monetization model. A Reddit developer with 50,000 users and $21K ARR was converting at well under 1%. GMass reached $200K/month with 500,000 signups. Neither data point is useful in isolation. If you're considering selling your extension, these benchmarks also feed directly into what a 10K-user Chrome extension is worth on the acquisition market.
Here's the pattern that shows up consistently across community data: your revenue-per-user goes *up* as you get better at converting, not as your user count grows. Getting from 0.5% conversion to 2% conversion is worth more than doubling your install base — at least at early stages.
Three variables drive the outcome more than anything else:
- Niche specificity — a tool targeting a defined professional audience (developers, marketers, recruiters) commands higher prices and converts better than a general productivity tool.
- Monetization model fit — subscriptions suit tools used daily; lifetime deals suit one-time utilities; usage-based billing suits AI-powered tools with real per-call costs.
- Timing of the upgrade prompt — users who see the paywall at the right moment (after experiencing value, not before) convert at 3–5x the rate of those shown it at install.
The $862k average is noise. A row with a user count is a target.
This guide's table is a range by band. Chrome Goldmine attaches an estimated monthly range to 9,656 expired extensions that already had users. You pick a listing whose historical users sit in the band you are willing to build toward.
$23.20 one-time · 30-day refund · lifetime quarterly updates
Chrome Extension Revenue Benchmarks by User Count
This table maps realistic revenue ranges to active user tiers across three common monetization models. Numbers are derived from publicly reported indie maker case studies and community benchmarks — not industry averages distorted by outliers.
Revenue Benchmark Table
| Active Users | Freemium (2–5% conversion) | Subscription ($5–$15/mo) | LTD / One-Time ($29–$99) | Notes |
|---|---|---|---|---|
| 100–500 | $0–$50/mo | $10–$75/mo | $50–$500 (one-time) | Pre-PMF stage; focus on feedback, not revenue |
| 500–2,000 | $10–$100/mo | $25–$300/mo | $200–$2,000 (one-time) | First signals of conversion; test pricing |
| 2,000–10,000 | $50–$500/mo | $100–$1,500/mo | $1,000–$10,000 (LTD launch) | Viable indie income at upper end |
| 10,000–50,000 | $500–$2,500/mo | $500–$7,500/mo | $5,000–$30,000 (LTD launch) | Matches Reddit case: 50K users, $21K ARR |
| 50,000–200,000 | $2,500–$10,000/mo | $2,500–$30,000/mo | LTD less practical at scale | Requires active conversion optimization |
| 200,000+ | $10,000–$200,000+/mo | $20,000–$200,000+/mo | GMass-tier ($200K/mo MRR) | Compounding at scale; team required |
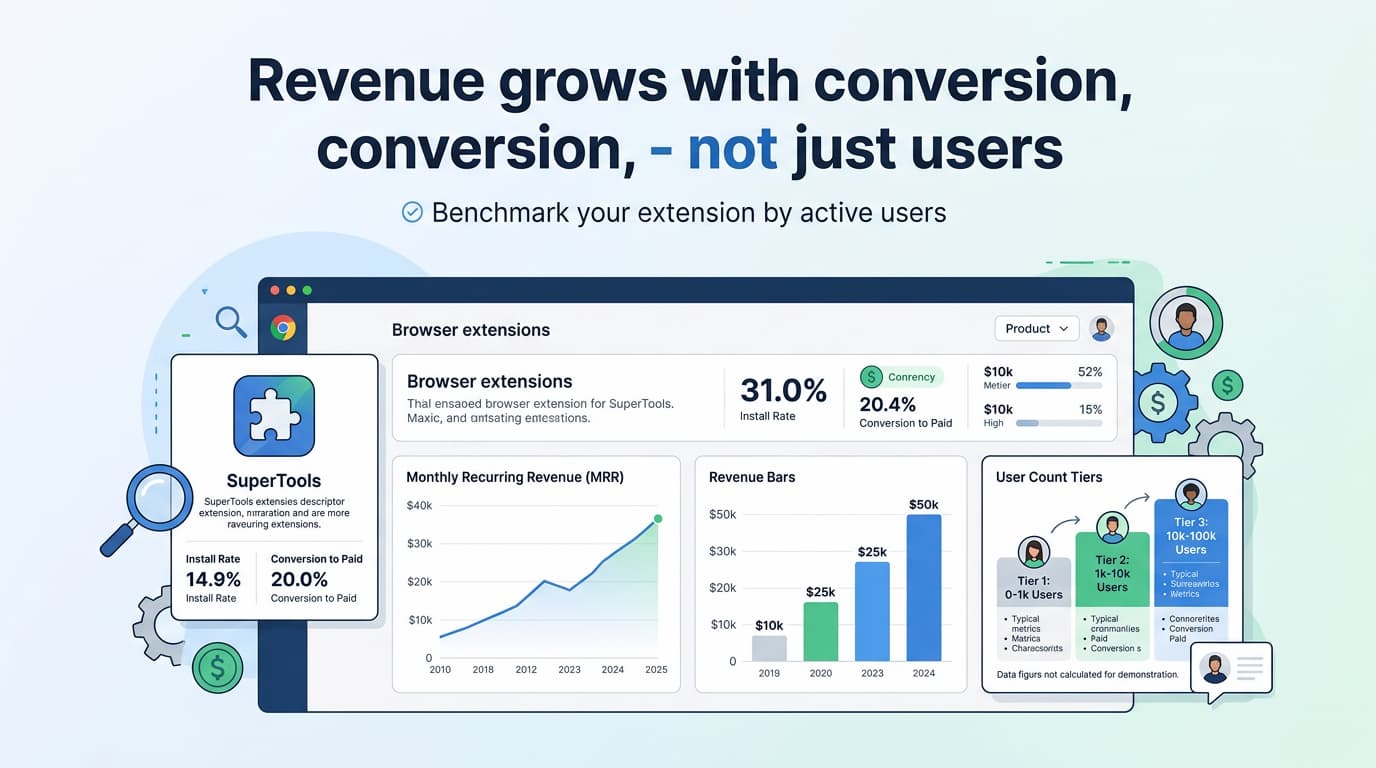
Assumptions: Freemium conversion rate range of 2–5% applied to active (weekly) users, not total installs. Subscription pricing based on $5–$15/month range common in indie extension market. LTD pricing based on $29–$99 one-time range, consistent with AppSumo/PitchGround benchmarks. Case study anchor: Reddit user with 50,000 users reported $21K ARR (~$1,750/month), implying sub-1% conversion — used as a lower-bound calibration point. These ranges are estimates derived from publicly reported indie maker outcomes (2020–2025); real results vary significantly by niche, feature split, and pricing execution.
Same bands, specific listings
The table above is a range. These public sample rows already publish a historical user count and an estimated monthly range. Map them onto the table before you set a target.
| Extension | Historical users | Table band | Est. monthly | Difficulty |
|---|---|---|---|---|
| Session StackProductivity | 48,200 | 10k–50k | $500–$1,600 | Low |
| Tab Suspender ReloadedProductivity | 91,400 | 50k–200k | $600–$1,800 | Medium |
| Reading Mode CleanAccessibility | 64,100 | 50k–200k | $400–$1,200 | Low |
| Coupon ClipperShopping | 40,500 | 10k–50k | $800–$2,400 | Medium |
| Grammar LiteWriting | 36,700 | 10k–50k | $1,000–$3,000 | High |
| Price WatchShopping | 31,800 | 10k–50k | $700–$2,000 | Medium |
| New Tab DigestNew Tab | 27,300 | 10k–50k | $400–$1,400 | Medium |
| Dark SitesCustomization | 55,000 | 50k–200k | $300–$900 | Low |
The other 9,636 listings unlock at checkout. 20 rows are free.
$23.20 one-time · 30-day refund. Estimated monthly figures on Goldmine listings are conservative ranges derived from historical users and category benchmarks — not guaranteed income. They exist so you can place a specific listing onto the bands in the table above.
Chrome Extension MRR Calculator (free)
Plug your user count, conversion rate, and ARPU into the same bands. No signup, no email.
After you get a monthly number, come back here (or use the calculator's “Browse Extension Ideas”) and match that user count to sample listings.
For a deeper look at how to choose between these models, see our monetization pillar guide. And if you're considering lifetime deals specifically, check out our AppSumo & PitchGround guide.
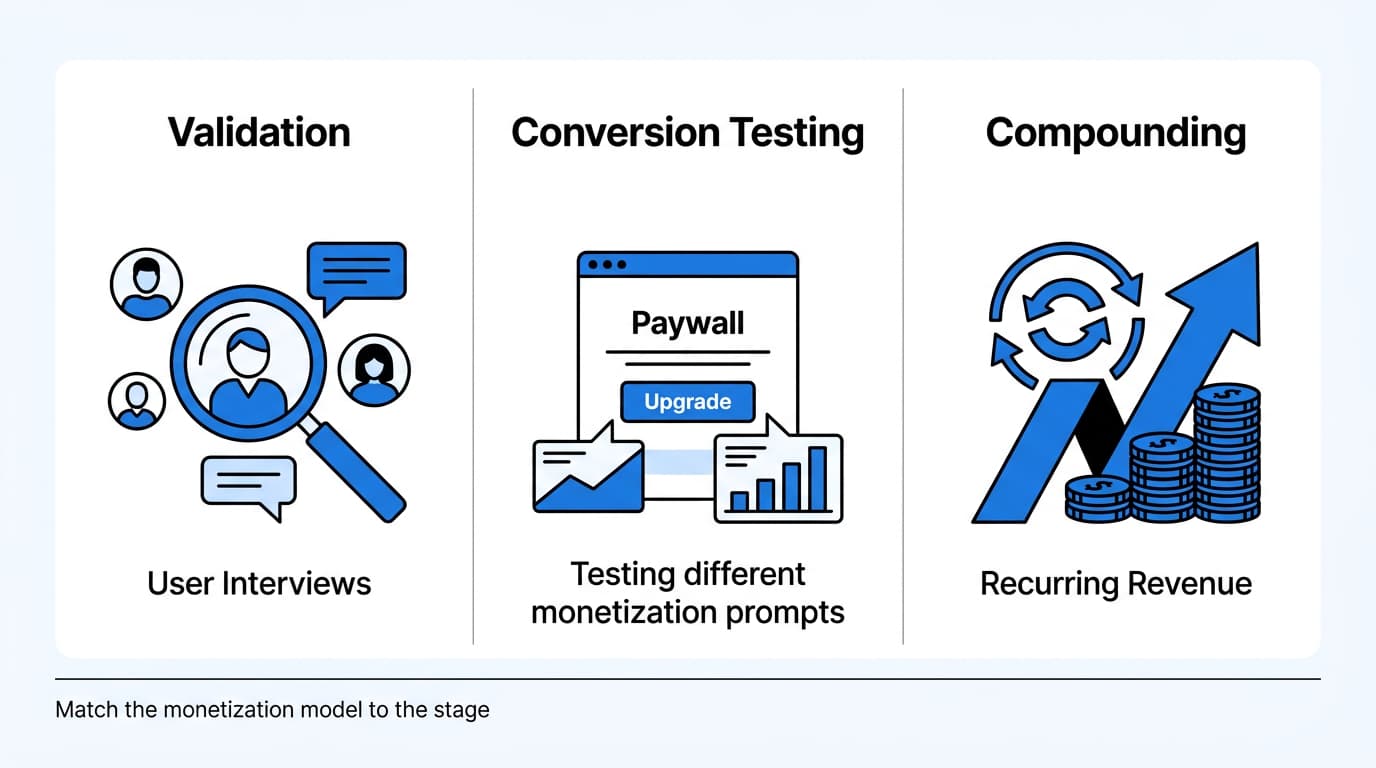
What Drives Revenue at Each Stage
The benchmark table tells you *what* to expect. This section tells you *why* the numbers look the way they do at each stage — and what to actually do about it.
Under 2,000 Users: Validation Over Revenue
At this stage, your conversion data is too noisy to optimize. A 3% conversion rate on 500 users is 15 paying customers — statistically meaningful, but one bad month of churn wipes it out. Your priority here is not optimizing your paywall; it's finding the 20 users who would genuinely miss your extension if it disappeared and learning exactly why.
Browse AI launched in 2021 and grew to $1.3M/year (Starter Story). The early work wasn't conversion optimization — it was identifying a specific, underserved use case (no-code web scraping) and building a free tier that demonstrated the value immediately.
2,000–10,000 Users: The Conversion Testing Window
This is the range where monetization model choice starts to matter. At 5,000 active users with a 2% conversion rate and a $10/month subscription, you're looking at $1,000/month — a real signal that the model works. At 0.5% conversion (which the Reddit 50K-user case implies), you're at $250/month, which means the model or the pricing needs adjusting before you scale.
Test your upgrade prompt placement first. Most indie makers underestimate how much the *timing* of the paywall matters. Users who hit a usage limit mid-task convert at a dramatically higher rate than those shown an upgrade screen on first install. For pricing guidance, see our pricing strategy guide.
10,000+ Users: Compounding or Stagnating
Extensions that reach 10,000 active users fall into one of two patterns: they compound (conversion improves with iteration, revenue grows faster than user count) or they stagnate (install count climbs but revenue doesn't follow). Momentum grew from a personal dashboard project to nearly $1M/year (Starter Story) — that kind of trajectory comes from compounding, not just user volume.
The difference is almost always conversion infrastructure: whether the upgrade path is frictionless, whether the paid tier is clearly differentiated, and whether the extension surfaces the right prompt at the right moment. Platforms like Outseta can help manage this billing infrastructure so you can focus on the product. For a deep dive into structuring your free and paid tiers, see our freemium Chrome extension guide.
Where a listing helps at each stage
| Extension | Historical users | Table band | Est. monthly | Difficulty |
|---|---|---|---|---|
| Session StackProductivity | 48,200 | 10k–50k | $500–$1,600 | Low |
| Coupon ClipperShopping | 40,500 | 10k–50k | $800–$2,400 | Medium |
Why the "Average" Benchmark Will Mislead You
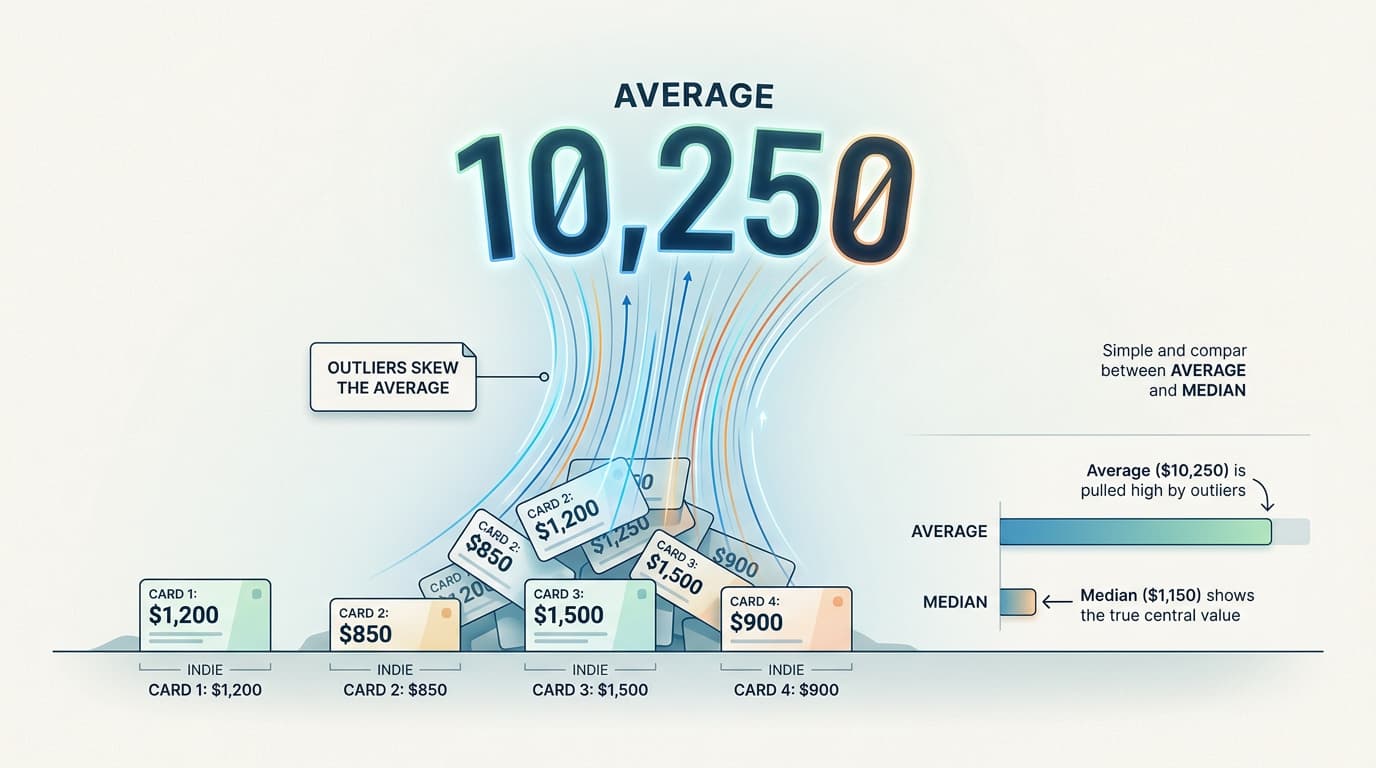
The most commonly cited figure for Chrome extension revenue is around $862,000/year, sourced from Starter Story's profitability analysis. You should treat this number as almost meaningless for planning purposes.
GMass earns $5.4M/year. SkyVerge earns $4.2M/year. A handful of large players pull the average far above what a solo developer or two-person team can realistically target in year one or two. These are multi-year compounding businesses with teams, not solo maker projects.
What the community data actually shows is that indie extension developers operating alone or in small teams typically reach:
- $100–$500/month within 6–12 months if they have 1,000–5,000 active users and a working paywall.
- $1,000–$3,000/month within 12–18 months with 5,000–20,000 users and active conversion optimization.
- $5,000+/month is possible with 20,000+ engaged users in a well-defined niche — but it requires treating conversion rate as a product metric, not an afterthought.
The Reddit case study ($21K ARR, 50K users) is more instructive than any industry average. It shows what a real extension looks like at scale when conversion hasn't been optimized — and it's the baseline you should benchmark against, not GMass.
Median-style thinking is why Chrome Goldmine publishes an estimated monthly *range* per listing instead of one vanity average — you can see those ranges on the 20 free sample rows.
Common Benchmarking Mistakes Indie Makers Make
Measuring installs instead of active users. Total install count is a vanity metric. Chrome extensions accumulate installs that never get used again after the first day. Your benchmark should be weekly or monthly active users — people who open your extension at least once in the measurement period. A 50,000-install extension with 5,000 weekly actives has a fundamentally different revenue profile than one with 40,000 actives.
Optimizing conversion rate before fixing churn. If your paying users cancel within 60 days, acquiring more conversions doesn't compound — it just runs on a treadmill. Track your monthly churn rate as a separate metric before you put energy into improving conversion. Fixing 15% monthly churn is almost always worth more than improving conversion from 2% to 3%. Automated email sequences via MailerLite can help reduce churn through onboarding drips and re-engagement campaigns. If you're layering revenue streams, affiliate marketing can add passive income alongside your subscription model without increasing churn risk.
Benchmarking against the wrong peer group. Comparing your early-stage extension against GMass or Momentum creates false discouragement and false benchmarks. The useful comparison is developers at a similar user count and niche — community discussions on Reddit and Indie Hackers are your best real-world data sources for this. Expired extensions in your category — with user counts attached are a tighter peer set than GMass.
Is Tracking Chrome Extension Revenue Benchmarks Worth Your Time?
Yes — but only if you're benchmarking the right metrics. Here's a simple ROI framework for thinking about the effort.
| Stage | Time to Set Up Tracking | Revenue Impact (Range) | What to Measure |
|---|---|---|---|
| Pre-revenue (0–500 users) | 2–4 hours | $0–$50/mo | Active users, retention, feature usage |
| Early revenue (500–5,000 users) | 4–8 hours | $25–$500/mo | Conversion rate, churn, upgrade trigger events |
| Growth stage (5,000–50,000 users) | 8–20 hours | $500–$7,500/mo | ARPU, LTV, paywall A/B test results |
| Scale (50,000+ users) | Ongoing (dedicated tool) | $2,500–$200,000+/mo | All of the above plus cohort retention |
Assumptions: Time estimates assume self-built tracking using free tools (Plausible, Mixpanel free tier, or custom event logging). Revenue ranges derived from community case studies and the benchmark table above. These are estimates; actual outcomes depend on niche, pricing, and execution quality.
$23.20 vs. another afternoon of guessing your band
The tracking table above is about measuring your extension. Goldmine is for the moment before that, when you still need a candidate whose historical users make a band in the benchmark table look reachable.
$23.20 one-time · 30-day refund · lifetime quarterly updates
Conclusion
Chrome extension revenue benchmarks only help you if they're grounded in realistic data — not averages pulled up by multi-million-dollar outliers. The benchmark table in this article gives you a tier-by-tier target range based on actual community outcomes across freemium, subscription, and LTD models.
The key insight: revenue scales with conversion rate optimization more than with raw user growth, especially in the 2,000–20,000 user range where most indie makers spend the bulk of their time. Getting your active-user-to-paying-customer ratio right is the lever that matters most.
Use the table as your baseline. Track active users, not installs. Fix churn before you optimize conversion. And compare yourself to makers at your scale — not to GMass. For a broader look at the extension landscape and how your niche stacks up, explore the 2026 expired Chrome extensions market analysis.
Pick a listing whose users already match a row in the table
You have the bands. The listings have the numbers.
9,656 expired extensions with historical users and estimated monthly revenue. 20 rows are live with no signup. $23.20 one-time. 30-day refund.
4.9★ · 45+ indie makers · quarterly updates for life
“The competitor analysis alone is worth 10× the price.” — Sarah T.
One-time. Was $29. Instant Notion workspace + CSV + Quick Start Guide.
Keep Reading
- Chrome extension monetization pillar guide
- Chrome extension pricing strategy
- Freemium Chrome extension guide
- AppSumo & PitchGround lifetime deal guide
- What a 10K-user Chrome extension is worth
- How to sell your Chrome extension
- 2026 expired Chrome extensions market analysis
- Buying an established Chrome extension business